
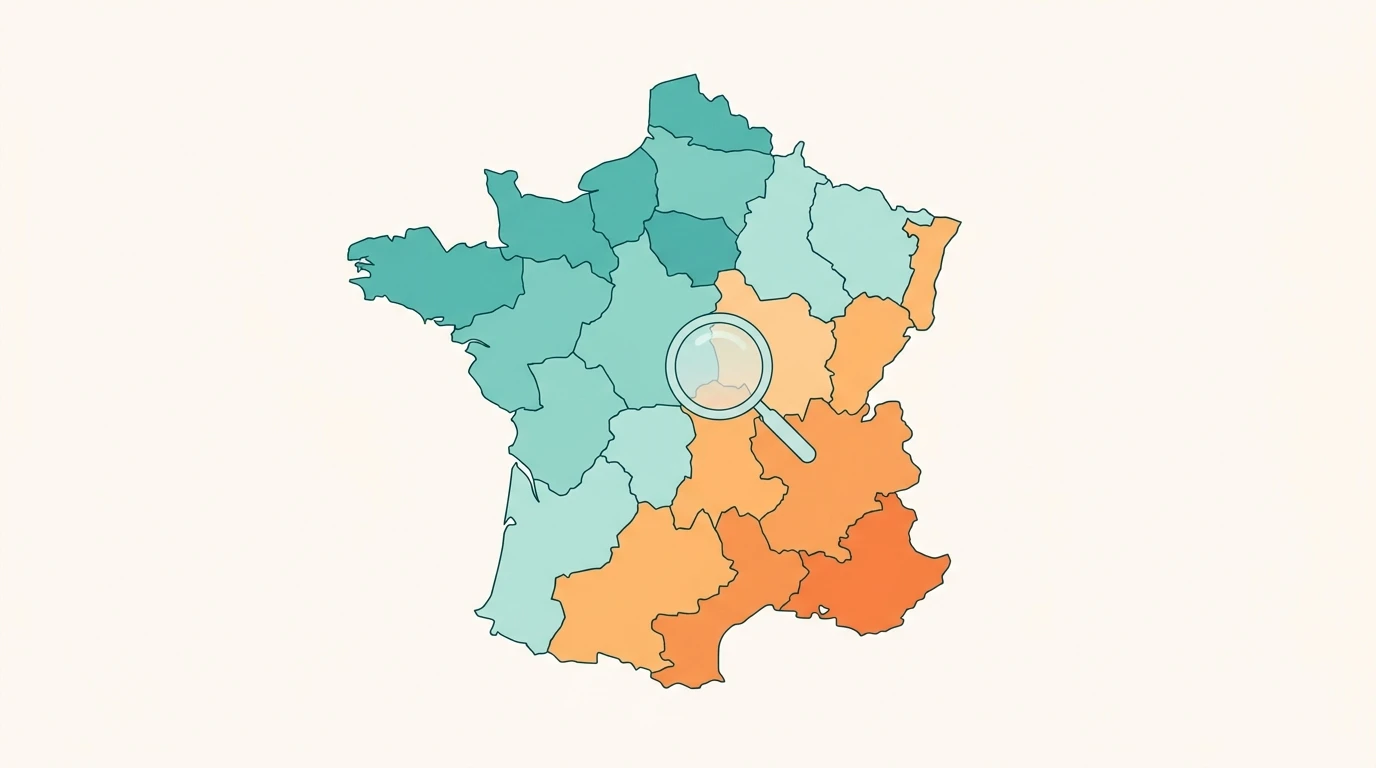
Baromètre Alternel: apprenticeship contract interruptions, region by region
Estimated reading time: 7 minutes
The number that circulates about apprenticeship ruptures is national. The reality a CFA director manages is regional, and the two can be 16 points apart.
Officially, 39% of apprenticeship contracts are interrupted before their term (DEPP, InserJeunes, cumul 2022-2023 and 2023-2024). In Pays de la Loire, the figure is 30%. In La Réunion, 55%. A placement team in Nantes and one in Saint-Denis are running different jobs under the same national headline.
This is the first edition of a series we will refresh with each InserJeunes data update, three times a year. The regional levels below are the ministry's own published figures. What we add, computed from the open data, is the piece no one publishes: the spread inside each region, so a director can see where their own school sits without anyone ranking them.
What this indicator measures, precisely
The metric is the DEPP's "part des contrats d'apprentissage interrompus avant leur terme": the risk that an apprenticeship contract is broken more than two months before its originally planned end date, over the contract's planned duration.
Two things it is not.
It is not the DARES rupture rate you see in the press (22% of 2024 contracts broken within nine months; 33% of 2022 contracts over the full duration). Different denominators, different windows, attributed to the employer rather than the CFA. Never compare the two numerically.
It is not a dropout rate either. An apprentice can break a contract, sign with a new employer and still graduate. InserJeunes tracks that separately, as the "taux d'interruption de formation", and that indicator ranks regions differently. Contract interruptions are an employer-relationship event. That is exactly why they belong on a relations entreprises team's radar.
The regional league table
DEPP official figures, apprentices in final year of training, cumul 2022-2023 and 2023-2024:
| Rank | Region | Contracts interrupted before term | Apprentices (final year) |
|---|---|---|---|
| 1 | La Réunion | 55% | 13,644 |
| 2 | Corse | 47% | 2,323 |
| 3 | Provence-Alpes-Côte d'Azur | 45% | 50,557 |
| 4 | Île-de-France | 42% | 118,052 |
| 5 | Occitanie | 41% | 51,211 |
| 6 | Hauts-de-France | 40% | 47,672 |
| 7 | Guadeloupe | 39% | 3,026 |
| 8 | Guyane | 39% | 1,218 |
| 9 | Martinique | 39% | 1,438 |
| 10 | Grand Est | 38% | 45,150 |
| 11 | Nouvelle-Aquitaine | 37% | 54,006 |
| 12 | Auvergne-Rhône-Alpes | 37% | 76,854 |
| 13 | Centre-Val de Loire | 36% | 22,712 |
| 14 | Normandie | 35% | 33,656 |
| 15 | Bourgogne-Franche-Comté | 34% | 27,745 |
| 16 | Bretagne | 33% | 31,351 |
| 17 | Pays de la Loire | 30% | 46,412 |
A 25-point spread separates the two ends. And the pattern is not a small-region artifact: Île-de-France, with 118,000 final-year apprentices, sits at 42%, five points above the national level. PACA, at 45%, interrupts three contracts in seven.
Before anyone in Nantes takes a bow: a regional rate reflects the local sector mix, company sizes and labour market at least as much as CFA practice. La Réunion's 55% says more about the structure of its economy than about its training schools. The table locates the problem. It does not assign the blame.
The diploma-level surprise is smaller than advertised, and bigger
A finding that circulated from the open data had BTS interruptions ahead of CAP, a neat "higher level, more ruptures" story. On the official weighted figures, it evaporates: CAP and BTS are tied at 42%.
The spread worth talking about is elsewhere:
| Diploma level | Contracts interrupted before term |
|---|---|
| CAP | 42% |
| BTS | 42% |
| Autre niveau 3 | 41% |
| Bac Pro | 38% |
| Brevet Professionnel | 38% |
| Autre niveau 5 | 36% |
| Autre niveau 4 | 32% |
| MC niveau 3 | 22% |
| MC niveau 4 | 15% |
The mentions complémentaires interrupt at 15 to 22%, against 42% for CAP and BTS. A 27-point range across diploma types. Short, specialized, post-diploma formats hold their contracts dramatically better than the two big entry-level and bac+2 workhorses. If your school's mix leans CAP-BTS, your baseline risk is structurally at the top of the range, whatever your region.
What the average hides: the spread inside your region
No official publication gives you what follows, and it is the reason we built this barometer.
A regional average is a poor mirror for a single school. From the InserJeunes open data (per-establishment, so computed at CFA level and sitting somewhat below the weighted official levels by construction), we computed the quartile bands of the interruption rate inside each region. Read your region's row and place your own number in it:
| Region | Best quarter below | Median | Worst quarter above |
|---|---|---|---|
| La Réunion | 37.0% | 50.0% | 65.4% |
| Provence-Alpes-Côte d'Azur | 31.5% | 44.0% | 54.7% |
| Île-de-France | 25.0% | 36.5% | 48.0% |
| Grand Est | 27.2% | 36.2% | 46.0% |
| Occitanie | 27.0% | 36.0% | 47.6% |
| Hauts-de-France | 27.8% | 35.5% | 45.7% |
| Normandie | 25.3% | 33.7% | 41.8% |
| Centre-Val de Loire | 26.0% | 33.5% | 38.5% |
| Bourgogne-Franche-Comté | 25.3% | 33.0% | 40.4% |
| Auvergne-Rhône-Alpes | 25.4% | 33.0% | 43.0% |
| Bretagne | 22.8% | 31.5% | 40.2% |
| Nouvelle-Aquitaine | 22.9% | 30.6% | 41.8% |
| Pays de la Loire | 17.7% | 25.5% | 34.6% |
(We publish no bands for Corse and the DOM: fewer than 20 establishments carry a value in the open data, too few for a distribution.)
The within-region spread dwarfs the between-region one. In Île-de-France, the best quarter of establishments sits below 25% while the worst sits above 48%. Two CFAs on the same métro line can live in different statistical worlds. Whatever your region's rank, the room to move inside it is enormous.
To find your own number: the InserJeunes open data is public and searchable by UAI on data.education.gouv.fr, both for interruption rates by diploma level and for the insertion indicators. One minute, no account.
Breaking contracts and placing graduates are two different problems
InserJeunes also publishes a "valeur ajoutée" for each CFA: its apprentices' employment rate six months after leaving, minus the rate a statistical model expects given the students' profiles, the courses offered and local unemployment. Positive means the school beats its context.
You would expect schools that hold their contracts to also place their leavers well. The data barely agrees. Across the 1,914 CFAs with both indicators, the correlation is weak (r = -0.21, explaining roughly 4% of the variance). Splitting at the median interruption rate and at zero value-added, 44% of establishments land in an off-diagonal quadrant: they hold contracts but underplace, or they lose contracts yet still place their leavers better than expected.
Contract stability and insertion performance are largely independent. A school fighting ruptures needs employer-side work: matching quality, tutor relationships, a re-placement process for when contracts break anyway. A school with weak value-added needs different levers entirely. Diagnose them separately, because fixing one will not fix the other.
Methodology, in plain terms
Source: Depp, plateforme de données ouvertes data.education.gouv.fr, traitement Alternel. Regional and diploma-level rates are DEPP's official published figures (workbooks extracted February 2026, covering the pooled 2022-2023 and 2023-2024 school years; the pooling means consecutive editions share a cohort). The quartile bands and the value-added analysis are our computation from the per-establishment open data (latest vintage "cumul 2023-2024", updated 20 July 2026); those are establishment-level statistics, unweighted by school size, which is why their levels sit below the official weighted rates. Missing values are suppressed by DEPP for small cohorts and excluded, never imputed. We publish no multi-year trend for now: one vintage is absent from the open series, and the panel of establishments has tripled since 2018, which would contaminate any line we drew. And a house rule: no CFA is ever named or ranked here. The data lets anyone rank schools. We work for them, so we publish the bands and let each director place themselves.
The full computation script and tables are reproducible; the dataset updates three times a year, and this barometer will follow it.
Alternel works on the employer side of exactly this problem: finding and qualifying the companies in a school's territory, so that matches start better and re-placements after a rupture start faster.
If you want the next edition in your inbox, or your region read against your own numbers, tell us. A conversation, not a demo.
Sources
- DEPP - InserJeunes, apprentis sortis en 2023-2024, données régionales: official regional and diploma-level interruption rates, apprentice headcounts.
- data.education.gouv.fr - InserJeunes par CFA: per-establishment open data behind the quartile bands and value-added analysis (Licence Ouverte 2.0).
- DEPP-DARES - Note d'Information n° 26-27, insertion des apprentis: companion insertion results, 73% in salaried employment two years out.
- DARES - Séries longues : le contrat d'apprentissage: the distinct DARES rupture rates (22% at nine months, 2024 cohort) cited for contrast.
- InserJeunes - site public: the reference platform for looking up a school by name or UAI.